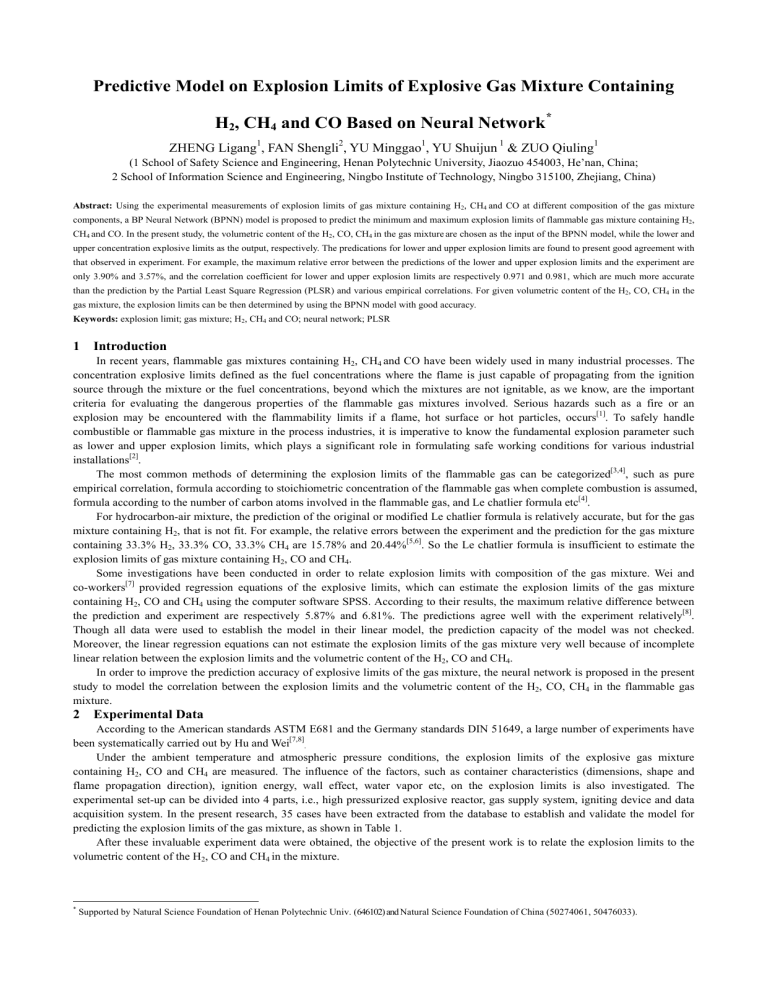
Predictive Model on Explosion Limits of Explosive Gas Mixture Containing H2, CH4 and CO Based on Neural Network * ZHENG Ligang1, FAN Shengli2, YU Minggao1, YU Shuijun 1 & ZUO Qiuling1 (1 School of Safety Science and Engineering, Henan Polytechnic University, Jiaozuo 454003, He’nan, China; 2 School of Information Science and Engineering, Ningbo Institute of Technology, Ningbo 315100, Zhejiang, China) Abstract: Using the experimental measurements of explosion limits of gas mixture containing H2, CH4 and CO at different composition of the gas mixture components, a BP Neural Network (BPNN) model is proposed to predict the minimum and maximum explosion limits of flammable gas mixture containing H2, CH4 and CO. In the present study, the volumetric content of the H2, CO, CH4 in the gas mixture are chosen as the input of the BPNN model, while the lower and upper concentration explosive limits as the output, respectively. The predications for lower and upper explosion limits are found to present good agreement with that observed in experiment. For example, the maximum relative error between the predictions of the lower and upper explosion limits and the experiment are only 3.90% and 3.57%, and the correlation coefficient for lower and upper explosion limits are respectively 0.971 and 0.981, which are much more accurate than the prediction by the Partial Least Square Regression (PLSR) and various empirical correlations. For given volumetric content of the H2, CO, CH4 in the gas mixture, the explosion limits can be then determined by using the BPNN model with good accuracy. Keywords: explosion limit; gas mixture; H2, CH4 and CO; neural network; PLSR 1 Introduction In recent years, flammable gas mixtures containing H2, CH4 and CO have been widely used in many industrial processes. The concentration explosive limits defined as the fuel concentrations where the flame is just capable of propagating from the ignition source through the mixture or the fuel concentrations, beyond which the mixtures are not ignitable, as we know, are the important criteria for evaluating the dangerous properties of the flammable gas mixtures involved. Serious hazards such as a fire or an explosion may be encountered with the flammability limits if a flame, hot surface or hot particles, occurs[1]. To safely handle combustible or flammable gas mixture in the process industries, it is imperative to know the fundamental explosion parameter such as lower and upper explosion limits, which plays a significant role in formulating safe working conditions for various industrial installations[2]. The most common methods of determining the explosion limits of the flammable gas can be categorized[3,4], such as pure empirical correlation, formula according to stoichiometric concentration of the flammable gas when complete combustion is assumed, formula according to the number of carbon atoms involved in the flammable gas, and Le chatlier formula etc[4]. For hydrocarbon-air mixture, the prediction of the original or modified Le chatlier formula is relatively accurate, but for the gas mixture containing H2, that is not fit. For example, the relative errors between the experiment and the prediction for the gas mixture containing 33.3% H2, 33.3% CO, 33.3% CH4 are 15.78% and 20.44%[5,6]. So the Le chatlier formula is insufficient to estimate the explosion limits of gas mixture containing H2, CO and CH4. Some investigations have been conducted in order to relate explosion limits with composition of the gas mixture. Wei and co-workers[7] provided regression equations of the explosive limits, which can estimate the explosion limits of the gas mixture containing H2, CO and CH4 using the computer software SPSS. According to their results, the maximum relative difference between the prediction and experiment are respectively 5.87% and 6.81%. The predictions agree well with the experiment relatively[8]. Though all data were used to establish the model in their linear model, the prediction capacity of the model was not checked. Moreover, the linear regression equations can not estimate the explosion limits of the gas mixture very well because of incomplete linear relation between the explosion limits and the volumetric content of the H2, CO and CH4. In order to improve the prediction accuracy of explosive limits of the gas mixture, the neural network is proposed in the present study to model the correlation between the explosion limits and the volumetric content of the H2, CO, CH4 in the flammable gas mixture. 2 Experimental Data According to the American standards ASTM E681 and the Germany standards DIN 51649, a large number of experiments have been systematically carried out by Hu and Wei[7,8]. Under the ambient temperature and atmospheric pressure conditions, the explosion limits of the explosive gas mixture containing H2, CO and CH4 are measured. The influence of the factors, such as container characteristics (dimensions, shape and flame propagation direction), ignition energy, wall effect, water vapor etc, on the explosion limits is also investigated. The experimental set-up can be divided into 4 parts, i.e., high pressurized explosive reactor, gas supply system, igniting device and data acquisition system. In the present research, 35 cases have been extracted from the database to establish and validate the model for predicting the explosion limits of the gas mixture, as shown in Table 1. After these invaluable experiment data were obtained, the objective of the present work is to relate the explosion limits to the volumetric content of the H2, CO and CH4 in the mixture. * Supported by Natural Science Foundation of Henan Polytechnic Univ. (646102) and Natural Science Foundation of China (50274061, 50476033). Table 1 No. 1 2 3 4 5 6 7 8 9 10 11 12 13 14 15 16 17 18 19 20 21 22 23 24 25 26 27 28 29 30 31 32 33 34 35 3 Experimental measurements of the explosion limits of gas mixture containing H2, CH4 and CO Component of the gas mixture/Vol % Experimental explosion limit Lower Explosion Upper Explosion H2 CH4 CO CO2 N2 O2 Limit (LEL)/% Limit (UEL) /% 64.59 0.65 5.28 0.81 28.17 0.5 68.28 6.08 78.84 1.19 6.02 1.13 12.3 0.52 71.02 4.72 69.66 2.31 1.5 0.05 26.23 0.25 65 5.83 74.99 1.51 2.29 0 21.01 0.2 69.8 5.46 39.29 1.5 30.89 7.28 20.54 0.5 63.93 7.89 40.95 1.06 35.18 4.45 18.05 0.31 69.73 8.08 33 2.58 27.14 9.28 27.47 0.53 54.15 8.66 36.02 1.81 27.25 9.4 25.13 0.39 57.53 8.25 35.08 1.98 33.58 5.84 22.9 0.62 63.66 8.79 44.82 1.06 30.12 5.16 18.06 0.78 69.52 7.38 39.35 1.83 29.59 5.87 22.41 0.95 62.02 7.92 35.95 2.47 27.44 8.85 24.79 0.5 55.48 8.13 37.99 2.5 29.87 8.72 20.17 0.75 60.24 7.81 36.1 1.82 28.93 9.35 23.33 0.47 61.47 8.43 39.66 1.75 31.19 6.91 20.02 0.47 65.39 7.76 40.01 1.47 30.56 8.01 19.4 0.55 65.25 7.8 42.28 1.62 29.27 8.35 18.12 0.36 62.55 7.46 33.4 2.7 25.03 9.44 28.52 0.91 53.01 8.32 35.55 1.5 31.35 8.05 22.93 0.62 60.13 8.75 36.09 1.49 27.84 6.51 27.49 0.58 63.1 8.26 55.96 1.12 1.6 25.07 16.05 0.2 62.58 6.86 55.02 1.33 1.47 23.44 18.51 0.23 60.01 7.33 47.17 2.19 1.97 25.64 23.85 0.18 53.17 7.53 53.4 0.91 1.69 24.93 18.82 0.25 58.55 7.62 74.45 1.04 0 0 24.51 0 67.21 5.67 76.17 0.97 0 0 22.86 0 70.17 5.16 56.52 5.98 0 0 37.5 0 52.67 6.91 57.07 6.12 0 0 36.81 0 54.94 6.45 56.63 5.66 0 0 37.71 0 53.42 6.53 43.18 18.03 0 0 38.79 0 32.35 7.03 43.62 6.4 0 0 49.98 0 48.8 7.89 45.48 7.27 0 0 47.25 0 48.79 7.77 57.64 6.14 0 0 36.22 0 55.12 6.69 62 15.5 0 0 22.5 0 45.06 5.524 57.79 14.17 0 0 28.04 0 42.63 5.76 BP Neural Network Used for Modeling Explosion Limits The artificial neural network emerges as a general, compact and fast way to model a complex system. The widely used back-propagation (BP) neural network is a feed-forward, multi-layer network, which can be considered as non-linear mapping of the input pattern to the output pattern. The ability to approximate a complicated function and information processing of the neural network completely depends on the weight of the link between the neurons. Because these weights cannot be pre-determined for a large-scale neural network, the learning ability is necessary for a neural network to adjust the weights from the training pattern. Such an interactive process is called a learning phase, in which all the examples are presented to the artificial neural network. The most popular and successful learning algorithm used to train multi-layer networks is the BP scheme, and some modifications, such as the momentum strategy and the adaptive learning rate coefficient method, have been used to improve the performance of the original version of the BP algorithm. Structure of the neural network used in the present study has one input layer, one hidden layer, and one output layer, as schematically shown in Fig.1. The input layer with three neurons comprising the three volumetric content of the H2, CO, CH4 and the output layer with a single neuron corresponding to the lower or upper explosion limit, are pre-determined by the characteristics of the problem investigated. The work determining the number of the neurons in the hidden layer is very difficult and troubled. With underestimated number of hidden layer neurons, the network can not map sufficiently the input pattern to the out pattern, while with the overestimated number of the hidden layer neurons, the resulting overfitting make the ability to predict the untrained input pattern poor. In general, the number of the hidden layer neurons is determined empirically through the trial-and-test process or method. In the present study, hidden layer of 4, 5, 6, 7, 8, 9, 10 neurons have been tried to check the optimal network structure, and finally, the network with hidden layer of 6 neurons is determined through the method mentioned above. Input Layer Hidden Layer Output Layer H2 LEL(UEL) CH4 CO Fig.1 Structure of the neural network used in this study Using the neural network to model the lower and upper explosion limits characteristics of the gas mixture containing H2, CO, CH4, the function between the volumetric content of the H2, CO, CH4 in the gas mixture and the lower and upper explosion limits can then be determined after the training phase of the neural network. The neural network can give a good answer to an untrained input pattern. The accuracy and robustness of an artificial neural network are significantly affected by the availability of the training data. Also, the preprocessing work such as the scaling of validity data, the grouping of data into three sets, i.e., the training set, the validating set and the testing set, has significant influence on the predicting capacity and generalization ability of the network. The main principle is that the training set available should capture the feature and information involved in the problems investigated. In the present study, total 35 samples of explosion limits are divided into three groups, (1) The training set for optimizing the weight of network: sample 1, 2, 3, 4, 5, 7, 9, 11, 13, 15, 17, 19, 21, 23, 25, 27, 29, 31, 33, 35; (2) The validating set for overcoming overfitting: sample 6, 8, 10, 12, 14, 16; (3) The testing set for verifying the generalization ability: sample 18, 20, 22, 24, 26, 28, 30, 32. 4 Results and Discussion The BPNN models for the explosion limits are established and trained using the Matlab computer software release 13 on PC[9,10]. Once the model is obtained, one can verify the accuracy of the model using the samples for test as input. For comparison, the Partial Least Square Regression (PLSR) method first proposed by Wold[11] is also introduced to estimate the explosion limits. A comparison to BPNN is made in order to judge their predictive capacities in the present study. Due to space limitation, the description of PLSR is omitted. Details on PLSR and its application can be found in Refs [11] and [12]. Regression coefficients for dependent variables are listed in Table 2. Table 2 Coefficients of PLSR model for LEL and UEL Term LEL UEL H2 −0.096 4 −0.498 8 CH4 −0.102 −1.253 4 CO −0.027 2 0.409 No. 1 2 3 9 75 8 R =0.993 7 Training data Validating data Testing data 6 5 4 5 6 7 8 Experim ental lower explosion lim it/% 9 Predicted upper explosion limit/% Predicted lower explosion limit/% A useful visualization of prediction quality is to plot predicted explosion limits against measured results, as shown in Fig.2. Fig.2(a) represents the predicted lower explosion limits and Fig.2(b) represents the upper one. These discrete data points are found to fall on the diagonal in these plots very well, which demonstrated that the predictions are in good agreement with the experimental measurements. 70 65 60 55 R = 0 .9 8 8 50 45 T ra in in g d a ta V a lid a tin g d a ta T e stin g d a ta 40 35 30 30 35 40 45 50 55 60 65 70 75 E xp e rim en tal up p er e xp lo sio n lim it/% (a) LEL (b) UEL Fig.2 Predicted explosion limits against measured results The multiple correlation coefficient R, the minimum relative error a, and the maximum relative error b are also used as measures of quality of a model. For best fit, R=1 and a=b=0%. The results of BPNN show that R of the lower explosion limit is 0.995 and 0.971 for the learning set and for the testing set, respectively, while R of the upper explosion limit is 0.992 and 0.981 for the learning set and for the testing set, respectively. As mentioned in refs [12] and [13], a value of R of 0.7 is generally acceptable, 0.8 is good, and 0.9 or higher is excellent. In the present study, especially for non-linear correlations, R values reached up to 0.98. The relative error between the predication and the measurement is plotted against every data point, as illustrated in Fig.3 and Table 3. For the training set, the minimum, maximum and averaged relative errors of the lower explosion limit are 3.76%, 0.019% and 1.78%, while that of upper explosion limit is respectively 3.93%, 0.065% and 1.46%. For the testing set, the minimum, maximum and averaged relative errors of the lower explosion limit are 3.90%, 0.029% and 1.20%, while that of upper explosion limit is respectively 3.57%, 1.09% and 2.33%. Because of absence of overfitting, the generalization ability of the BPNN is very good. 4 The relative error for UEL/% The relative error for LEL/% 4 3 2 1 0 5 10 15 20 25 30 3 2 1 0 35 5 10 Experimental point 15 20 25 30 35 Experimental point (a) LEL (b) UEL Relative error between predicted explosion limits and measured results Fig.3 Table 3 Training Results of BPNN and MLR models Prediction BPNN PLS BPNN PLS R a b R a b R a b R a b LEL 0.995 3.76 0.019 0.983 5.84 0.066 0.971 3.90 0.029 0.973 5.85 0.326 UEL 0.992 3.93 0.065 0.978 5.81 0.053 0.981 3.57 1.05 0.976 6.81 0.508 Where R is correlation coefficient between the prediction and experiment, a is the minimum relative error between prediction and experiment and b the maximum relative error between the prediction and experiment. Property As shown in Table 3, summary results derived form BPNN and PLSR are assembled in terms of R, a, b. A comparison on the distribution of the relative error is made, as plotted in Fig.4. Fig.4(a) represents comparison on the relative error distribution of LEL, Fig.4(b) represents that of UEL. It is statistically obtained that the BPNN could estimate lower explosion limit with a relative error less than 1% for about 37%, less than 2% for about 60% and less than 3% for about 86% of the experiment samples, upper explosion limit with a relative error less than 1% for about 31.5%, less than 2% for about 57% and less than 3% for about 77% of the experiment samples, which indicated that the correlations were highly successful. While the PLSR model could estimate lower explosion limit with a relative error less than 3% for about 43%, upper explosion limit with a relative error less than 3% for about 53% of the experiment samples. However, considerable data points have the relative error more than 5% when PLSR is used, which did not observed using BPNN. In other words, the prediction derived from BPNN is better than that from the PLSR when considering the accuracy. 40 40 BPNN PLSR 35 30 30 25 25 Percentage/% Percentage/% 35 20 15 20 15 10 10 5 5 0 BPNN PLSR 0 0 1 2 3 Relative error/% 4 5 6 0 1 2 3 4 Relative error/% (a) LEL (b) UEL Fig.4 Comparisons of relative error distribution 5 6 7 5 Conclusions As fundamental explosion parameter, lower and upper explosion limits of flammable gas mixture containing H2, CH4 and CO are estimated by using non-linear method, i.e., neural network. The simulation results indicate BPNN can predict the explosion limits with much confidence. The predications are found to present good agreement with that observed in experiment in terms of the multiple correlation coefficient R, the minimum relative error a, and the maximum relative error b. For comparison, partial least square regression is also applied. The distribution of the relative error is given for both models, which can be used to judge superiority of the models. Comparative study shows BPNN can estimate the explosion limits with narrower range of the relative error distribution and more accurate than PLSR. References [1] Smedt G. De, Corte F. de, Notele R., et al. Comparison of two standard test methods for determining explosion limits of gases at atmospheric conditions. [2] Shu Chimin, Wen Pojiun. Investigation of the flammability zone of o-xylene under various pressures and oxygen concentrations at 150 ℃. Journal of [3] Bower P C. Self-heating: Evaluating and Controlling the Hazards. London: H M Stationary Office, 1984 [4] Xu Manggui, Xu Jingcai. Explosion limits and calculated methods of combustible gas. Journal of Xi’an University of Science and Technology, 2005, [5] Tian Guansan, Chen Hongtao, Wang Xuedong. Analysis and estimates on the explosive limits of the city gas. Journal of Shangdong Institute of Arch Eng, [6] Tian Guansan, Li Xingquan. Analysis and estimates of the explosive limit of the town gas. China Safety Science Journal, 2002, 12(6): 48-51(in Chinese) [7] Wei Yongsheng, Zhou Bangzhi, Zheng Mingyan. The multivaried regression analysis of ploybasic explosive mixture gas containing H2, CO and CH4. Journal of Hazardous Materials, 1999, 70(3): 105-113 Loss Prevention in the Process Industries, 2002, 15(4): 253-263 25(2): 139-142(in Chinese) 2002, 17(2): 56-60(in Chinese) Chemical Research and Application, 2004, 16(3): 419-420(in Chinese) [8] Hu Yaoyuan, Zhou Bangzhi, Yang Yuanfa, et al. Study on the explosion limits of the ploybasic explosive mixture gas containing H2, CO and CH4 and its container factors. Science in China(Series B), 2002, 45(1): 30-36(in Chinese) [9] Zhou Hao, Zheng Ligang, Weng Anxin, et al. Development of boiler heat efficiency optimization system. Electric power, 2004, 37(2): 29-31(in Chinese) [10] Zhou Hao, Qian Xinping, Zheng Ligang, et al. The utility boiler low NOx combustion optimization based on ANN and simulated annealing algorithm. Environmental science, 2003, 24(6): 63-67(in Chinese) [11] Wold H. Partial least squares. Encyclopedia of Statistical Sciences. New York: Wiley.1984(6): 581-591 [12] Seggiani M. Empirical correlations of the ash fusion temperatures and temperature of critical viscosity for coal and biomass ashes. Fuel, 1999, 78(9): 1121-1225 [13] Lubomir Hadjiiski, Paul Geladi, Philip Hopke. A comparison of modeling nonlinear systems with artificial neural networks and partial least squares. Chemometrics and Intelligent Laboratory Systems, 1999, 49(1): 91-103
