Solutions for Discussion Sheet # 6
реклама
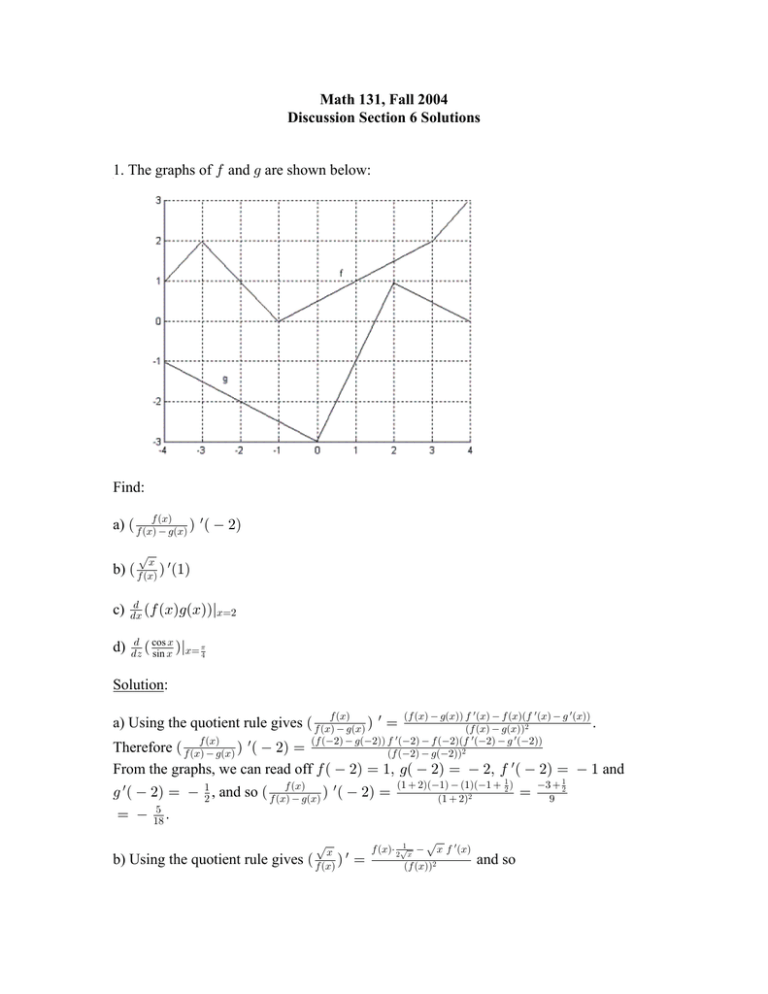
Math 131, Fall 2004 Discussion Section 6 Solutions 1. The graphs of 0 and 1 are shown below: Find: w a) Ð 0 ÐBÑ0 ÐBÑ 1ÐBÑ Ñ Ð #Ñ ÈB b) Ð 0 ÐBÑ Ñ w Ð"Ñ c) . .B Ð0 ÐBÑ1ÐBÑÑlBœ# d) . cos B 1 .D Ð sin B ÑlBœ % Solution: Ð0 ÐBÑ 1ÐBÑÑ 0 w ÐBÑ 0 ÐBÑÐ0 w ÐBÑ 1 w ÐBÑÑ . Ð0 ÐBÑ 1ÐBÑÑ# w w w Ð0 Ð#Ñ 1Ð#ÑÑ 0 Ð#Ñ 0 Ð#ÑÐ0 Ð#Ñ 1 Ð#ÑÑ Ð0 Ð#Ñ 1Ð#ÑÑ# w w a) Using the quotient rule gives Ð 0 ÐBÑ0 ÐBÑ 1ÐBÑ Ñ œ w Therefore Ð 0 ÐBÑ0 ÐBÑ 1ÐBÑ Ñ Ð #Ñ œ From the graphs, we can read off 0 Ð #Ñ œ "ß 1Ð #Ñ œ #ß 0 Ð #Ñ œ " and w 1 w Ð #Ñ œ "# , and so Ð 0 ÐBÑ0 ÐBÑ 1ÐBÑ Ñ Ð #Ñ œ & œ ") Þ ÈB b) Using the quotient rule gives Ð 0 ÐBÑ Ñ w œ Ð" #ÑÐ"Ñ Ð"ÑÐ" "# Ñ Ð" #Ñ# 0 ÐBц #È" B ÈB 0 w ÐBÑ Ð0 ÐBÑÑ# and so œ $ "# * ÈB Ð 0 ÐBÑ Ñ w Ð"Ñ œ 0 Ð"ц 0 Ð"Ñ œ " and 0 c) " #È " È" 0 w Ð"Ñ Ð0 Ð"ÑÑ# w Ð"Ñ œ "# , . From the graph we can read off ÈB so Ð 0 ÐBÑ Ñ w Ð"Ñ œ " # "# " œ !Þ . .B Ð0 ÐBÑ1ÐBÑÑ œ 0 ÐBÑ1 w ÐBÑ 0 w ÐBÑ1ÐBÑ, so . w w .B Ð0 ÐBÑ1ÐBÑÑlBœ# œ 0 Ð#Ñ1 Ð#Ñ 0 Ð#Ñ1Ð#ÑÞ The graph shows a sharp corner on the . graph at Ð#ß 1Ð#ÑÑß so 1 w Ð#Ñ does not exist. Therefore .B Ð0 ÐBÑ1ÐBÑÑlBœ# doesn't exist. d) Using the quotient rule gives # Ðsin BÑÐsin BÑ Ðcos BÑÐcos BÑ B cos# BÑ . cos B " # œ Ðsin sin œ sin #B # B œ csc B. .D Ð sin B Ñ œ sin# B . (This shows, by the way, that .B Ðcot BÑ œ csc# BÑÞ . cos B Therefore .D Ð sin B ÑlBœ 1% œ csc# Ð 1% Ñ œ Ð È## Ñ# œ #% œ # 2. How many tangent lines to the curve C œ B B " pass through the point Ð"ß #Ñ ? What are the coordinates where these lines touch the graph? .C Solution: .B œ ÐB ÐB"ÑÐ"ÑBÐ"Ñ œ ÐB " "Ñ# Þ "Ñ# Pick any point Ð+ß + + " Ñ on the graph. The tangent line there has slope equation of the tangent line at Ð+ß + + " Ñ is C + + " œ Ð+ " "Ñ# ÐB +ÑÞ For this tangent line to go through Ð"ß #Ñ, we would need that + " # + " œ Ð+ "Ñ# Ð" +Ñß or #Ð+ "Ñ# +Ð+ "Ñ œ " +ß or #+# %+ # +# + œ " +ß or +# %+ " œ !Þ " Ð+ "Ñ# , so the È È$ Solving for + with the quadratic formula gives + œ % „ # "' % œ % „# œ # „ È$ Þ # Only for + œ # È$ and # È$ does the tangent line through Ð+ß + + " Ñ pass through Ð"ß #ÑÞ For these values of +, the tangent lines touch the graph at È È ( # È$ ß # $ Ñ and Ð # È$ ß # $ ÑÞ " È$ " È$ The following figure is not necessary to solve the problem. But it does illustrate what's happening: 3. In the study of ecosystems, predator-prey models are often used to study the interaction between species. Consider a population of tundra wolves, given by [ Ð>Ñ and caribou, given by GÐ>Ñ, in northern Canada. The interaction of these populations has been modeled by the following system of equations: .G .> .[ .> œ +G ,G[ œ -[ .G[ where +ß ,ß -ß . are positive constants (which a biologist might estimate from population data). .[ a) What values of .G .> and .> correspond to stable populations? b) How would the statement “the caribou go extinct” be represented mathematically? c) What would lim .[ .> œ ! mean ? >Ä_ d) Suppose a population biologist looks at some data and (somehow) decides that the following values are reasonable estimates: + œ !Þ!& , œ !Þ!!" - œ !Þ!& . œ !Þ!!!" Find all population pairs ÐGß [ Ñ that lead to stable populations. According to this model, is it possible for the species to live in harmony or will one or both species become extinct? e) On each line of the original pair of equations, why is there both a positive and a negative term? Solutions: a) “The wolf population [ is stable” means that it has reached a constant value, so .[ .G .> œ !Þ Similarly, the population of caribou is stable if .> œ !. b) “The caribou go extinct” could be expressed as lim GÐ>Ñ œ ! (“as time passes, the >Ä_ number of Caribou approaches !”). However, there cannot be a fractional number of caribou. If GÐ>Ñ “gets closer and closer to ! as time passesß ” it must be that eventually G œ !Þ c) lim .[ .> œ ! means that that rate of change of the size of the wolf population >Ä_ approaches !, that is, that the wolf population [ approaches some stable value. .> d) With the values given, the equations become .[ .G .> œ !Þ!&G !Þ!!"G[ œ !Þ!&[ !Þ!!!"G[ By part a) stable populations requires: !Þ!&G !Þ!!"G[ œ GÐ!Þ!& !Þ!!"[ Ñ œ ! œ !Þ!&[ !Þ!!!"G[ œ [ Ð !Þ!& !Þ!!!"GÑ œ ! The first equation has solutions G œ ! or [ œ !Þ!!" !Þ!& œ &!Þ If G œ !ß the second equation becomes !Þ!&[ œ ! or [ œ !Þ The pair ÐG œ !ß [ œ !Ñ is one way to have a stable situation between the caribou and wolf populations. If [ œ &!, the second equation becomes #Þ& Ð !Þ!&ÑÐ&!Ñ !Þ!!!"Ð&!ÑG œ #Þ& !Þ!!&G œ ! or G œ !Þ!!& œ &!!Þ The pair ÐG œ &!!ß [ œ &!Ñ is another way to have a stable situation between the caribou and wolf populations. The species can live in harmony. e) Looking at the equation .G .> œ !Þ!&G !Þ!!"G[ : if there were no wolves, then .G .> œ !Þ!&G ! so the caribous populations would be constantly growing (no predators!). !Þ!&G corresponds to a “birth rate.” The negative term !Þ!!"G[ corresponds to a “death rate” that comes from the “interaction” of wolves and caribou. In this model, .G .> œ rate of change in caribou population œ “birth rate death rate.” The same sort of analysis applies to .[ .> œ !Þ!&[ !Þ!!!"G[ . If there were no .[ caribou, the equation would be .> œ !Þ!&[ ! and the wolf population would be decreasing (no prey). The positive term contributes to growing the wolf population due to interaction of the wolves (predators) with the prey (caribou).
