A N A NALYSIS OF D EEP N EURAL N ETWORK M ODELS
FOR P RACTICAL A PPLICATIONS
arXiv:1605.07678v4 [cs.CV] 14 Apr 2017
Alfredo Canziani & Eugenio Culurciello
Weldon School of Biomedical Engineering
Purdue University
{canziani,euge}@purdue.edu
Adam Paszke
Faculty of Mathematics, Informatics and Mechanics
University of Warsaw
a.paszke@students.mimuw.edu.pl
A BSTRACT
Since the emergence of Deep Neural Networks (DNNs) as a prominent technique
in the field of computer vision, the ImageNet classification challenge has played a
major role in advancing the state-of-the-art. While accuracy figures have steadily
increased, the resource utilisation of winning models has not been properly taken
into account. In this work, we present a comprehensive analysis of important metrics in practical applications: accuracy, memory footprint, parameters, operations
count, inference time and power consumption. Key findings are: (1) power consumption is independent of batch size and architecture; (2) accuracy and inference
time are in a hyperbolic relationship; (3) energy constraint is an upper bound on
the maximum achievable accuracy and model complexity; (4) the number of operations is a reliable estimate of the inference time. We believe our analysis provides
a compelling set of information that helps design and engineer efficient DNNs.
1
I NTRODUCTION
Since the breakthrough in 2012 ImageNet competition (Russakovsky et al., 2015) achieved by
AlexNet (Krizhevsky et al., 2012) — the first entry that used a Deep Neural Network (DNN) —
several other DNNs with increasing complexity have been submitted to the challenge in order to
achieve better performance.
In the ImageNet classification challenge, the ultimate goal is to obtain the highest accuracy in a
multi-class classification problem framework, regardless of the actual inference time. We believe
that this has given rise to several problems. Firstly, it is now normal practice to run several trained
instances of a given model over multiple similar instances of each validation image. This practice,
also know as model averaging or ensemble of DNNs, dramatically increases the amount of computation required at inference time to achieve the published accuracy. Secondly, model selection is
hindered by the fact that different submissions are evaluating their (ensemble of) models a different
number of times on the validation images, and therefore the reported accuracy is biased on the specific sampling technique (and ensemble size). Thirdly, there is currently no incentive in speeding up
inference time, which is a key element in practical applications of these models, and affects resource
utilisation, power-consumption, and latency.
This article aims to compare state-of-the-art DNN architectures, submitted for the ImageNet challenge over the last 4 years, in terms of computational requirements and accuracy. We compare these
architectures on multiple metrics related to resource utilisation in actual deployments: accuracy,
memory footprint, parameters, operations count, inference time and power consumption. The purpose of this paper is to stress the importance of these figures, which are essential hard constraints
for the optimisation of these networks in practical deployments and applications.
2
M ETHODS
In order to compare the quality of different models, we collected and analysed the accuracy values
reported in the literature. We immediately found that different sampling techniques do not allow for
a direct comparison of resource utilisation. For example, central-crop (top-5 validation) errors of a
1
80
Inception-v3
ResNet-50
75
ResNet-101
ResNet-34
Top-1 accuracy [%]
75
Top-1 accuracy [%]
Inception-v4
80
70
65
60
70
65
55
50
50
VGG-19
ResNet-18
GoogLeNet
BN-NIN
5M
60
55
Net Net -NIN Net Net t-18 -16 -19 t-34 t-50 -101 -152 n-v3 n-v4
AleNx-Alex BN EoogLReesNe VGG VGRGesNReesNeesNetesNecteptioceptio
G
B
R R In In
ENet
ResNet-152
VGG-16
35M
65M
95M
125M 155M
30
35
BN-AlexNet
AlexNet
0
5
10
15
20
25
Operations [G-Ops]
40
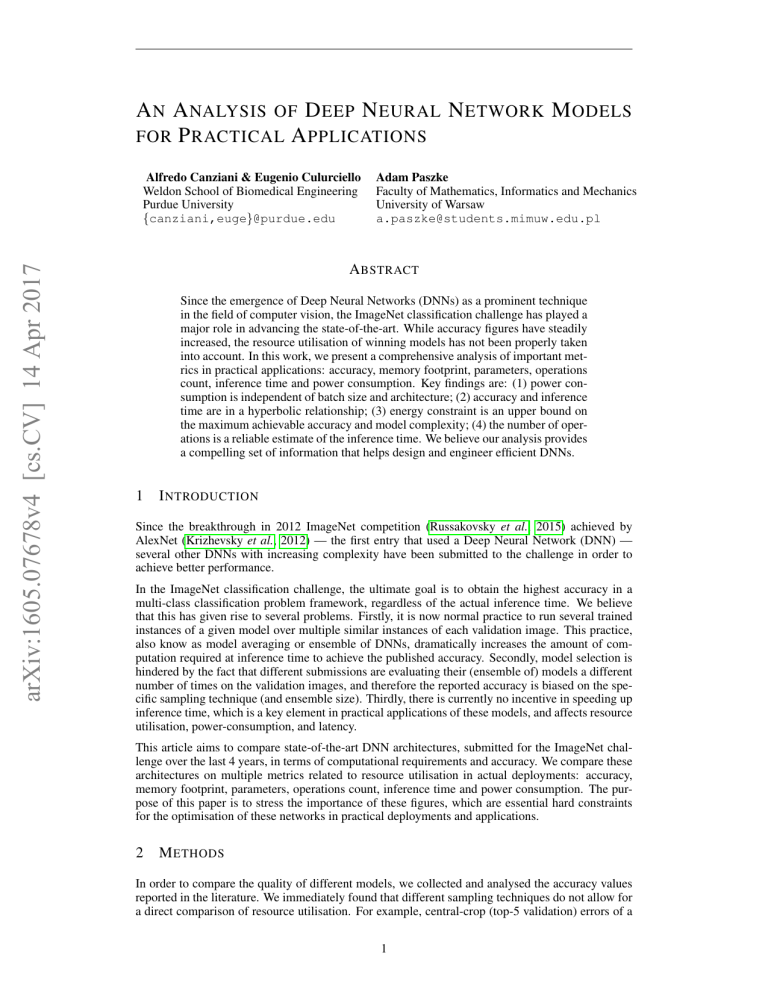
Figure 2: Top1 vs. operations, size ∝ parameters.
Top-1 one-crop accuracy versus amount of operations
required for a single forward pass. The size of the
blobs is proportional to the number of network parameters; a legend is reported in the bottom right corner, spanning from 5×10⁶ to 155×106 params. Both
these figures share the same y-axis, and the grey dots
highlight the centre of the blobs.
Figure 1: Top1 vs. network. Single-crop top-1 validation accuracies for top scoring single-model architectures. We introduce with this chart our choice of
colour scheme, which will be used throughout this
publication to distinguish effectively different architectures and their correspondent authors. Notice that
networks of the same group share the same hue, for
example ResNet are all variations of pink.
single run of VGG-161 (Simonyan & Zisserman, 2014) and GoogLeNet (Szegedy et al., 2014) are
8.70% and 10.07% respectively, revealing that VGG-16 performs better than GoogLeNet. When
models are run with 10-crop sampling,2 then the errors become 9.33% and 9.15% respectively, and
therefore VGG-16 will perform worse than GoogLeNet, using a single central-crop. For this reason,
we decided to base our analysis on re-evaluations of top-1 accuracies3 for all networks with a single
central-crop sampling technique (Zagoruyko, 2016).
For inference time and memory usage measurements we have used Torch7 (Collobert et al., 2011)
with cuDNN-v5 (Chetlur et al., 2014) and CUDA-v8 back-end. All experiments were conducted on
a JetPack-2.3 NVIDIA Jetson TX1 board (nVIDIA): an embedded visual computing system with
a 64-bit ARM R A57 CPU, a 1 T-Flop/s 256-core NVIDIA Maxwell GPU and 4 GB LPDDR4
of shared RAM. We use this resource-limited device to better underline the differences between
network architecture, but similar results can be obtained on most recent GPUs, such as the NVIDIA
K40 or Titan X, to name a few. Operation counts were obtained using an open-source tool that we
developed (Paszke, 2016). For measuring the power consumption, a Keysight 1146B Hall effect
current probe has been used with a Keysight MSO-X 2024A 200 MHz digital oscilloscope with a
sampling period of 2 s and 50 kSa/s sample rate. The system was powered by a Keysight E3645A
GPIB controlled DC power supply.
3
R ESULTS
In this section we report our results and comparisons. We analysed the following DDNs: AlexNet
(Krizhevsky et al., 2012), batch normalised AlexNet (Zagoruyko, 2016), batch normalised Network
In Network (NIN) (Lin et al., 2013), ENet (Paszke et al., 2016) for ImageNet (Culurciello, 2016),
GoogLeNet (Szegedy et al., 2014), VGG-16 and -19 (Simonyan & Zisserman, 2014), ResNet-18,
-34, -50, -101 and -152 (He et al., 2015), Inception-v3 (Szegedy et al., 2015) and Inception-v4
(Szegedy et al., 2016) since they obtained the highest performance, in these four years, on the
ImageNet (Russakovsky et al., 2015) challenge.
1
In the original paper this network is called VGG-D, which is the best performing network. Here we prefer
to highlight the number of layer utilised, so we will call it VGG-16 in this publication.
2
From a given image multiple patches are extracted: four corners plus central crop and their horizontal
mirrored twins.
3
Accuracy and error rate always sum to 100, therefore in this paper they are used interchangeably.
2
14
BN-NIN
GoogLeNet
Inception-v3
Inception-v4
AlexNet
BN-AlexNet
VGG-16
VGG-19
ResNet-18
ResNet-34
ResNet-50
ResNet-101
ResNet-152
ENet
100
50
20
13
Net power consumption [W]
Foward time per image [ms]
200
10
5
11
10
BN-NIN
GoogLeNet
Inception-v3
Inception-v4
AlexNet
9
1
2
4
8
Batch size [ / ]
16
32
8
64
1
2
4
BN-AlexNet
VGG-16
VGG-19
ResNet-18
ResNet-34
8
Batch size [ / ]
16
ResNet-50
ResNet-101
ResNet-152
ENet
32
64
Figure 4: Power vs. batch size. Net power consumption (due only to the forward processing of several
DNNs) for different batch sizes. The idle power of
the TX1 board, with no HDMI screen connected, was
1.30 W on average. The max frequency component
of power supply current was 1.4 kHz, corresponding
to a Nyquist sampling frequency of 2.8 kHz.
Figure 3: Inference time vs. batch size. This
chart show inference time across different batch sizes
with a logarithmic ordinate and logarithmic abscissa.
Missing data points are due to lack of enough system
memory required to process larger batches. A speed
up of 3× is achieved by AlexNet due to better optimisation of its fully connected layers for larger batches.
3.1
12
ACCURACY
Figure 1 shows one-crop accuracies of the most relevant entries submitted to the ImageNet challenge, from the AlexNet (Krizhevsky et al., 2012), on the far left, to the best performing Inception-v4
(Szegedy et al., 2016). The newest ResNet and Inception architectures surpass all other architectures
by a significant margin of at least 7%.
Figure 2 provides a different, but more informative view of the accuracy values, because it also
visualises computational cost and number of network’s parameters. The first thing that is very apparent is that VGG, even though it is widely used in many applications, is by far the most expensive
architecture — both in terms of computational requirements and number of parameters. Its 16- and
19-layer implementations are in fact isolated from all other networks. The other architectures form a
steep straight line, that seems to start to flatten with the latest incarnations of Inception and ResNet.
This might suggest that models are reaching an inflection point on this data set. At this inflection
point, the costs — in terms of complexity — start to outweigh gains in accuracy. We will later show
that this trend is hyperbolic.
3.2
I NFERENCE T IME
Figure 3 reports inference time per image on each architecture, as a function of image batch size
(from 1 to 64). We notice that VGG processes one image in a fifth of a second, making it a less likely
contender in real-time applications on an NVIDIA TX1. AlexNet shows a speed up of roughly 3×
going from batch of 1 to 64 images, due to weak optimisation of its fully connected layers. It is a
very surprising finding, that will be further discussed in the next subsection.
3.3
P OWER
Power measurements are complicated by the high frequency swings in current consumption, which
required high sampling current read-out to avoid aliasing. In this work, we used a 200 MHz digital
oscilloscope with a current probe, as reported in section 2. Other measuring instruments, such as
an AC power strip with 2 Hz sampling rate, or a GPIB controlled DC power supply with 12 Hz
sampling rate, did not provide enough bandwidth to properly conduct power measurements.
In figure 4 we see that the power consumption is mostly independent with the batch size. Low power
values for AlexNet (batch of 1) and VGG (batch of 2) are associated to slower forward times per
image, as shown in figure 3.
3
Maximum net memory utilisation [MB]
1000
VGG-19
ResNet-18
ResNet-34
ResNet-50
ResNet-101
500
300
200
1
2
4
8
Batch size [ / ]
Batch of 1 image
800
Maximum net memory utilisation [MB]
BN-NIN
GoogLeNet
Inception-v3
AlexNet
BN-AlexNet
VGG-16
2000
16
32
700
600
400
300
200
100
64
0
1.3
500
0
100
200
300
Parameters [MB]
400
500
Figure 6: Memory vs. parameters count. Detailed view on static parameters allocation and corresponding memory utilisation. Minimum memory
of 200 MB, linear afterwards with slope 1.30.
Figure 5: Memory vs. batch size. Maximum system memory utilisation for batches of different sizes.
Memory usage shows a knee graph, due to the network model memory static allocation and the variable
memory used by batch size.
Batch of 1 image
Batch of 16 images
40
Operations [G-Ops]
35
30
25
20
15
10
5
0
0
20
40
60
80
100
120
Foward time per image [ms]
140
160
0
20
40
60
80
100
120
Foward time per image [ms]
140
160
Figure 7: Operations vs. inference time, size ∝ parameters. Relationship between operations and inference
time, for batches of size 1 and 16 (biggest size for which all architectures can still run). Not surprisingly, we
notice a linear trend, and therefore operations count represent a good estimation of inference time. Furthermore,
we can notice an increase in the slope of the trend for larger batches, which correspond to shorter inference
time due to batch processing optimisation.
3.4
M EMORY
We analysed system memory consumption of the TX1 device, which uses shared memory for both
CPU and GPU. Figure 5 shows that the maximum system memory usage is initially constant and
then raises with the batch size. This is due the initial memory allocation of the network model —
which is the large static component — and the contribution of the memory required while processing
the batch, proportionally increasing with the number of images. In figure 6 we can also notice that
the initial allocation never drops below 200 MB, for network sized below 100 MB, and it is linear
afterwards, with respect to the parameters and a slope of 1.30.
3.5
O PERATIONS
Operations count is essential for establishing a rough estimate of inference time and hardware circuit
size, in case of custom implementation of neural network accelerators. In figure 7, for a batch of
16 images, there is a linear relationship between operations count and inference time per image.
Therefore, at design time, we can pose a constraint on the number of operation to keep processing
speed in a usable range for real-time applications or resource-limited deployments.
4
Batch of 1 image
Batch of 16 images
40
Operations [G-Ops]
35
30
25
20
15
10
5
0
9
10
11
12
Net power consumption [W]
13
9
10
11
12
Net power consumption [W]
13
Figure 8: Operations vs. power consumption, size ∝ parameters. Independency of power and operations is
shown by a lack of directionality of the distributions shown in these scatter charts. Full resources utilisation
and lower inference time for AlexNet architecture is reached with larger batches.
Batch of 1 image
Batch of 16 images
80
Accuracy [%]
75
70
65
60
55
50
0
20
40
60
80
100
Images per second [Hz]
120
140
0
20
40
60
80
100
Images per second [Hz]
120
140
Figure 9: Accuracy vs. inferences per second, size ∝ operations. Non trivial linear upper bound is shown
in these scatter plots, illustrating the relationship between prediction accuracy and throughput of all examined
architectures. These are the first charts in which the area of the blobs is proportional to the amount of operations,
instead of the parameters count. We can notice that larger blobs are concentrated on the left side of the charts,
in correspondence of low throughput, i.e. longer inference times. Most of the architectures lay on the linear
interface between the grey and white areas. If a network falls in the shaded area, it means it achieves exceptional
accuracy or inference speed. The white area indicates a suboptimal region. E.g. both AlexNet architectures
improve processing speed as larger batches are adopted, gaining 80 Hz.
3.6
O PERATIONS AND P OWER
In this section we analyse the relationship between power consumption and number of operations
required by a given model. Figure 8 reports that there is no specific power footprint for different architectures. When full resources utilisation is reached, generally with larger batch sizes, all networks
consume roughly an additional 11.8 W, with a standard deviation of 0.7 W. Idle power is 1.30 W.
This corresponds to the maximum system power at full utilisation. Therefore, if energy consumption
is one of our concerns, for example for battery-powered devices, one can simply choose the slowest
architecture which satisfies the application minimum requirements.
3.7
ACCURACY AND T HROUGHPUT
We note that there is a non-trivial linear upper bound between accuracy and number of inferences
per unit time. Figure 9 illustrates that for a given frame rate, the maximum accuracy that can be
achieved is linearly proportional to the frame rate itself. All networks analysed here come from
several publications, and have been independently trained by other research groups. A linear fit of
the accuracy shows all architecture trade accuracy vs. speed. Moreover, chosen a specific inference
time, one can now come up with the theoretical accuracy upper bound when resources are fully
5
Top-1 accuracy density [%/M-Params]
12
10
8
6
4
2
0
-19 -16 Net Net 152 101 n-v4 t-50 n-v3 t-34 t-18 -NIN Net ENet
VGG VGG Alex N-Alex esNet- esNet- ceptio ResNe ceptio ResNe ResNe BN oogLe
G
B R
R In
In
Figure 10: Accuracy per parameter vs. network. Information density (accuracy per parameters) is an efficiency metric that highlight that capacity of a specific architecture to better utilise its parametric space. Models
like VGG and AlexNet are clearly oversized, and do not take fully advantage of their potential learning ability. On the far right, ResNet-18, BN-NIN, GoogLeNet and ENet (marked by grey arrows) do a better job at
“squeezing” all their neurons to learn the given task, and are the winners of this section.
utilised, as seen in section 3.6. Since the power consumption is constant, we can even go one step
further, and obtain an upper bound in accuracy even for an energetic constraint, which could possibly
be an essential designing factor for a network that needs to run on an embedded system.
As the spoiler in section 3.1 gave already away, the linear nature of the accuracy vs. throughput
relationship translates into a hyperbolical one when the forward inference time is considered instead.
Then, given that the operations count is linear with the inference time, we get that the accuracy has
an hyperbolical dependency on the amount of computations that a network requires.
3.8
PARAMETERS U TILISATION
DNNs are known to be highly inefficient in utilising their full learning power (number of parameters
/ degrees of freedom). Prominent work (Han et al., 2015) exploits this flaw to reduce network
file size up to 50×, using weights pruning, quantisation and variable-length symbol encoding. It is
worth noticing that, using more efficient architectures to begin with may produce even more compact
representations. In figure 10 we clearly see that, although VGG has a better accuracy than AlexNet
(as shown by figure 1), its information density is worse. This means that the amount of degrees
of freedom introduced in the VGG architecture bring a lesser improvement in terms of accuracy.
Moreover, ENet (Paszke et al., 2016) — which we have specifically designed to be highly efficient
and it has been adapted and retrained on ImageNet (Culurciello, 2016) for this work — achieves the
highest score, showing that 24× less parameters are sufficient to provide state-of-the-art results.
4
C ONCLUSIONS
In this paper we analysed multiple state-of-the-art deep neural networks submitted to the ImageNet
challenge, in terms of accuracy, memory footprint, parameters, operations count, inference time
and power consumption. Our goal is to provide insights into the design choices that can lead to
efficient neural networks for practical application, and optimisation of the often-limited resources in
actual deployments, which lead us to the creation of ENet — or Efficient-Network — for ImageNet.
We show that accuracy and inference time are in a hyperbolic relationship: a little increment in
accuracy costs a lot of computational time. We show that number of operations in a network model
can effectively estimate inference time. We show that an energy constraint will set a specific upper
bound on the maximum achievable accuracy and model complexity, in terms of operations counts.
Finally, we show that ENet is the best architecture in terms of parameters space utilisation, squeezing
up to 13× more information per parameter used respect to the reference model AlexNet, and 24×
respect VGG-19.
6
ACKNOWLEDGMENTS
This paper would have not look so pretty without the Python Software Foundation, the matplotlib library and the communities of stackoverflow and TEX of StackExchange which I ought to
thank. This work is partly supported by the Office of Naval Research (ONR) grants N00014-12-10167, N00014-15-1-2791 and MURI N00014-10-1-0278. We gratefully acknowledge the support
of NVIDIA Corporation with the donation of the TX1, Titan X, K40 GPUs used for this research.
R EFERENCES
Sharan Chetlur, Cliff Woolley, Philippe Vandermersch, Jonathan Cohen, John Tran, Bryan Catanzaro, and Evan
Shelhamer. cuDNN: Efficient Primitives for Deep Learning. arXiv.org arXiv:1410.0759, 2014.
Ronan Collobert, Koray Kavukcuoglu, and Clément Farabet. Torch7: A matlab-like environment for machine
learning. In BigLearn, NIPS Workshop, number EPFL-CONF-192376, 2011.
Eugenio Culurciello. Training enet.
training-enet.html, 2016.
https://culurciello.github.io/tech/2016/06/20/
Song Han, Huizi Mao, and William J Dally. Deep compression: Compressing deep neural networks with
pruning, trained quantization and huffman coding. arXiv preprint arXiv:1510.00149, 2015.
Kaiming He, Xiangyu Zhang, Shaoqing Ren, and Jian Sun. Deep residual learning for image recognition. arXiv
preprint arXiv:1512.03385, 2015.
Alex Krizhevsky, Ilya Sutskever, and Geoffrey E Hinton. Imagenet classification with deep convolutional neural
networks. In Advances in neural information processing systems, pp. 1097–1105, 2012.
Min Lin, Qiang Chen, and Shuicheng Yan. Network in network. arXiv preprint arXiv:1312.4400, 2013.
nVIDIA. Jetson tx1 module. http://www.nvidia.com/object/jetson-tx1-module.html.
Adam Paszke. torch-opcounter. https://github.com/apaszke/torch-opCounter, 2016.
Adam Paszke, Abhishek Chaurasia, Sangpil Kim, and Eugenio Culurciello. Enet: A deep neural network
architecture for real-time semantic segmentation. arXiv preprint arXiv:1606.02147, 2016.
Olga Russakovsky, Jia Deng, Hao Su, Jonathan Krause, Sanjeev Satheesh, Sean Ma, Zhiheng Huang, Andrej Karpathy, Aditya Khosla, Michael Bernstein, et al. Imagenet large scale visual recognition challenge.
International Journal of Computer Vision, 115(3):211–252, 2015.
Karen Simonyan and Andrew Zisserman. Very deep convolutional networks for large-scale image recognition.
arXiv preprint arXiv:1409.1556, 2014.
Christian Szegedy, Wei Liu, Yangqing Jia, Pierre Sermanet, Scott Reed, Dragomir Anguelov, Dumitru Erhan, Vincent Vanhoucke, and Andrew Rabinovich. Going deeper with convolutions. arXiv preprint
arXiv:1409.4842, 2014.
Christian Szegedy, Vincent Vanhoucke, Sergey Ioffe, Jonathon Shlens, and Zbigniew Wojna. Rethinking the
inception architecture for computer vision. arXiv preprint arXiv:1512.00567, 2015.
Christian Szegedy, Sergey Ioffe, and Vincent Vanhoucke. Inception-v4, inception-resnet and the impact of
residual connections on learning. arXiv preprint arXiv:1602.07261, 2016.
Sergey Zagoruyko. imagenet-validation.torch.
validation.torch, 2016.
https://github.com/szagoruyko/imagenet-
7
