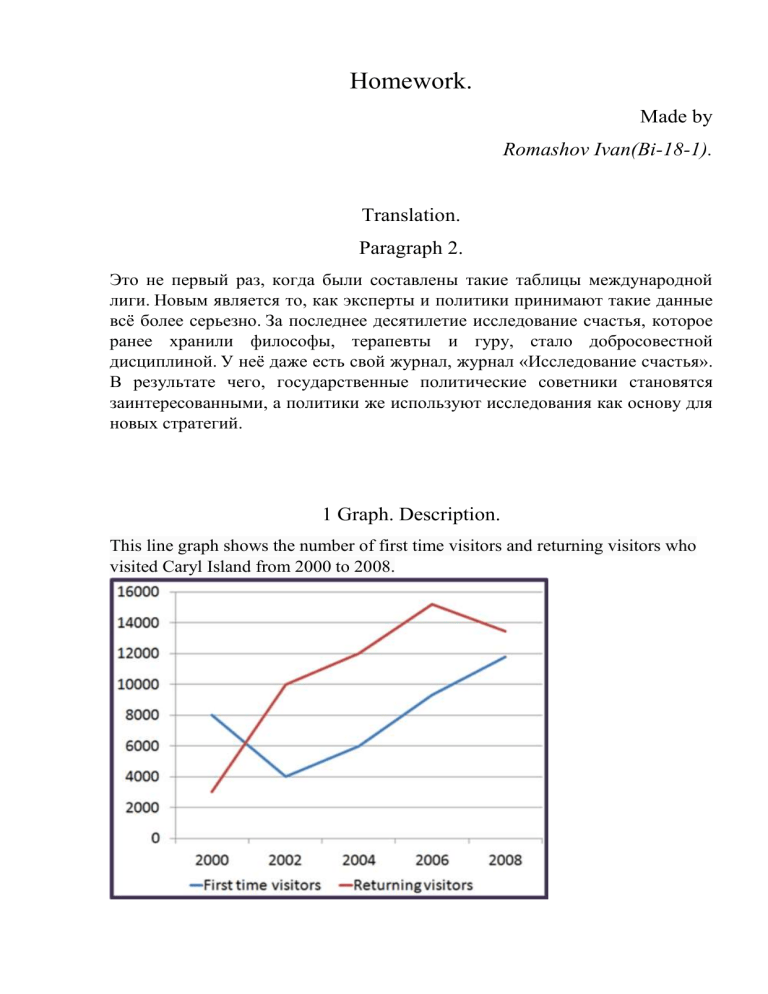
Homework. Made by Romashov Ivan(Bi-18-1). Translation. Paragraph 2. Это не первый раз, когда были составлены такие таблицы международной лиги. Новым является то, как эксперты и политики принимают такие данные всё более серьезно. За последнее десятилетие исследование счастья, которое ранее хранили философы, терапевты и гуру, стало добросовестной дисциплиной. У неё даже есть свой журнал, журнал «Исследование счастья». В результате чего, государственные политические советники становятся заинтересованными, а политики же используют исследования как основу для новых стратегий. 1 Graph. Description. This line graph shows the number of first time visitors and returning visitors who visited Caryl Island from 2000 to 2008. The diagram illustrates the difference between the number of people who visited Caryl for the first time and the number of returning people over a period of eight years. Overall, the number of visitors increased during the period from 2000 to 2008, despite the slight fluctuations during eight years. Besides, the number of two types of visitors increased from 2002 to 2006 with the same speed. In 2000 the number of first time people was 8,000. Their number plummeted to 4,000 by 2002. But after such a recession, the situation with visitors improved to the best: the number gradually increased every year. In 2008, the number reached almost 12,000. The number of returnees increased dramatically from 2000 to 2002. This was followed by another rise, but slower than the previous one, which lasted until 2006 and reached a little more than 15,000 people. However, after 2006 there was a decline. (150 words)
