СКОРОСТЬ КРОВОТОКА В АРТЕРИОЛАХ У БОЛЬНЫХ
реклама
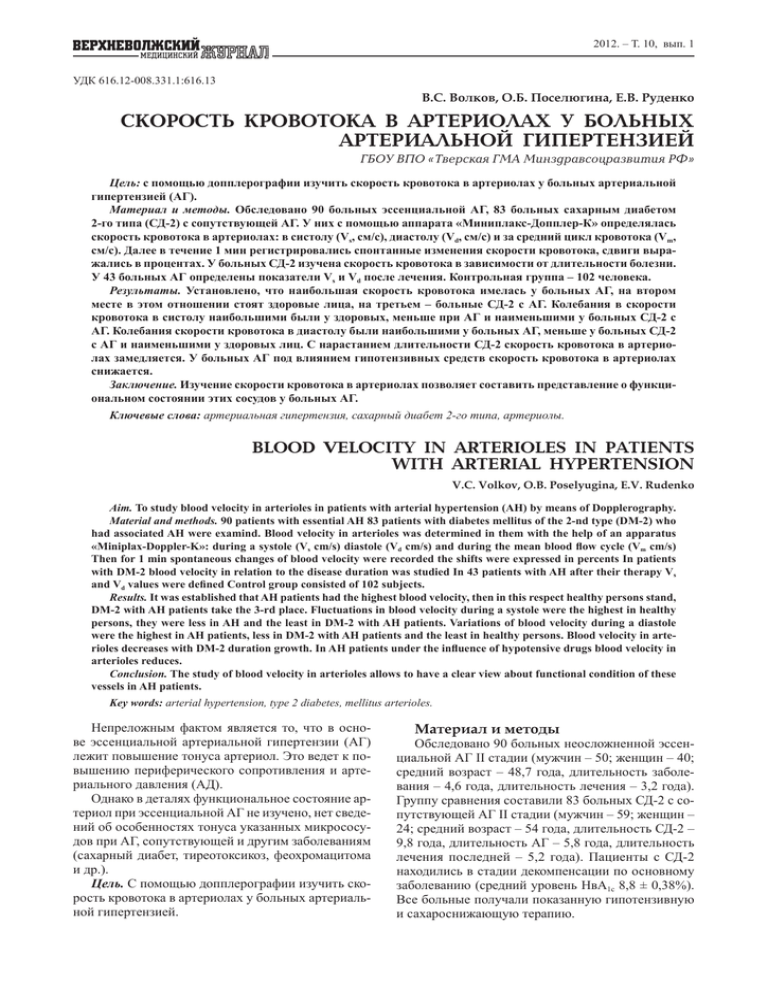
2012. – . 10, .1 616.12-008.331.1:616.13 . . , . . , . . СКОРОСТЬ КРОВОТОКА В АРТЕРИОЛАХ У БОЛЬНЫХ АРТЕРИАЛЬНОЙ ГИПЕРТЕНЗИЕЙ ГБОУ ВПО «Тверская ГМА Минздравсоцразвития РФ» : ( ). . 2- ( 90 -2) , 83 . : / ). (Vs, « (Vd, / ), - - » / ) 1 (Vm, . , . -2 43 Vs . Vd . – 102 , . , , – -2 . , . -2 -2 - , . -2 . . . . : , 2- , . BLOOD VELOCITY IN ARTERIOLES IN PATIENTS WITH ARTERIAL HYPERTENSION V.C. Volkov, O.B. Poselyugina, E.V. Rudenko Aim. To study blood velocity in arterioles in patients with arterial hypertension (AH) by means of Dopplerography. Material and methods. 90 patients with essential AH 83 patients with diabetes mellitus of the 2-nd type (DM-2) who had associated AH were examind. Blood velocity in arterioles was determined in them with the help of an apparatus «Miniplax-Doppler-K»: during a systole (Vs cm/s) diastole (Vd cm/s) and during the mean blood flow cycle (Vm cm/s) Then for 1 min spontaneous changes of blood velocity were recorded the shifts were expressed in percents In patients with DM-2 blood velocity in relation to the disease duration was studied In 43 patients with AH after their therapy Vs and Vd values were defined Control group consisted of 102 subjects. Results. It was established that AH patients had the highest blood velocity, then in this respect healthy persons stand, DM-2 with AH patients take the 3-rd place. Fluctuations in blood velocity during a systole were the highest in healthy persons, they were less in AH and the least in DM-2 with AH patients. Variations of blood velocity during a diastole were the highest in AH patients, less in DM-2 with AH patients and the least in healthy persons. Blood velocity in arterioles decreases with DM-2 duration growth. In AH patients under the influence of hypotensive drugs blood velocity in arterioles reduces. Conclusion. The study of blood velocity in arterioles allows to have a clear view about functional condition of these vessels in AH patients. Key words: arterial hypertension, type 2 diabetes, mellitus arterioles. , ( . ( ) - ). , - , ( , 90 II , – 4,6 . , 83 II 24; 9,8 ( – 54 , – 5,8 – 5,2 ). , – 40; – 3,2 ). -2 – 59; – -2 – , -2 – 50; , .). . ( – 48,7 ( 1 . 8,8 ± 0,38%). , III - ». 25 - , - : , . , 3,5 . : (V, / ), (V, / ) (V, / ). (0,25; 0,5; 0,75; 1 1 .1 , , « 2012. – . 10, . , - , -2. , , , , . , , , - ) . , , . , 43 . -2, ( 8 , ). -2 , , , . , -2 - . 27 1,4 . -2 , 24 – 6,2, 32 – 12,5 102 47,3 ( . -2 , ). . , GenuineIntel P ntium II Processor IntelMMXTM Technology Excel 7.0 Statistica 6,203. . , , . -2 , - . , - , . , , -2 - , - 3 . 1. , , . , , -2, , Na - , , . -2 , Ca , [1, 2]. , , -2 1 , 2(M ± m) , n = 102 V s, Vm, V d, / / / 13,2 ± 0,94 7,3 ± 0,38 4,3 ± 0,04 . . 2: , 1 , n = 90 17,7 ± 0,65 9,1 ± 3,8 8,7 ± 0,66 2 ,– , n = 83 8,6 ± 0,11 4,6 ± 0,09 3,1 ± 0,08 1 2 3 <0,05 <0,05 <0,05 <0,05 <0,05 <0,05 <0,05 <0,05 <0,05 -2 ; . 2- 3 – -2 10,5 17 [3]. 2012. – . 10, .1 . - , - , -2 - [4]. , -2 , , . , ) ( - ( ). . , -2 . , , , - , , . , , , - , , -2. , , . [4]. - -2 [5], [4]. , , -2, , , . - , , -2 , 50% -2 , , , . . , 90% Na .2 1 -2 - , . - , , . . -2 .2 , , , : , . - , -2 , . -2 ( - , ) . , , . 3. -2 ( , ). , -2 . 2 1 (M ± m , , n = 102 0,25 0,5 0,75 1 ,% 14,4 ± 0,91 10,4 ± 0,27 13,5 ± 0,61 14,3 ± 0,91 27,8 ,% 6,7 ± 0,68 8,2 ± 0,63 7,5 ± 0,62 6,6 ± 0,65 19,5 ,% 4,3 ± 0,49 4,4 ± 0,53 4,2 ± 0,59 4,3 ± 0,51 4,5 0,25 0,5 0,75 1 0,25 0,5 0,75 1 , n = 90 V s, / 18,8 ± 0,82 17,1 ± 0,68 16,1 ± 0,48 18,7 ± 0,83 14,4 Vm, / 8,4 ± 0,59 9,7 ± 0,38 9,7 ± 0,48 8,4 ± 0,59 13,4 Vd, / 9,8 ± 0,44 7,9 ± 0,32 7,3 ± 0,28 9,9 ± 0,45 35,6 %) , n = 90 1 2 3 8,8 ± 0,27 8,4 ± 0,25 8,4 ± 0,25 8,7 ± 0,25 4,5 <0,01 <0,01 <0,001 <0,001 <0,001 <0,001 <0,001 <0,05 <0,001 <0,001 <0,01 <0,001 <0,001 <0,05 <0,05 4,5 ± 0,24 4,5 ± 0,21 4,4 ± 0,17 4,8 ± 0,25 8,3 <0,01 <0,001 <0,001 <0,05 <0,05 >0,05 >0,05 <0,05 >0,05 >0,05 <0,001 <0,001 <0,001 <0,001 >0,05 3,2 ± 0,29 3,0 ± 0,35 3,3 ± 0,36 3,0 ± 0,34 9,0 >0,05 <0,05 >0,05 >0,05 <0,001 <0,001 <0,001 <0,001 <0,001 >0,05 <0,001 <0,001 <0,001 <0,001 <0,001 2012. – . 10, .1 3 (Vs, Vm, Vd) 2- 1. . - 2. (M ± m) , 2, , 1,4 ± 0,22 n = 27 , 6,2 ± 0,28 n = 24 , 12,5 ± 1,43 n = 32 , Vs 12,9 ± 0,47* 9,6 ± 0,23** – / Vm 8,0 ± 0,24* 5,7 ± 0,24* 3. Vd 6,6 ± 0,61* 4,0 ± 0,35* 22- 3- - . 4. 8,5 ± 1,27 4,7 ± 0,18 3,0 ± 0,31 .*– Vs, Vm, Vd 1( < 0,01); ** – . 2- - 3- . 5. ( < 0,001). 2- . , -2 . , , 43 Vd 6,7 ± 1,27 / , 3,73 ± 0,51 / ( 180/95 . 145/80 Vs 18,6 ± 0,28 14,47 ± 0,31 <0,01). . . 1. Ward R., Sparrow D., Landsberg L. et al. The influence of obesity, insulin and sympathetic nervous system activity on blood pressure // Clin. Res. – 1993. – Vol. 41. – P. 168–174. 2. Glans R.O., Bilo H.J., Donker A.J. The renal response to exogenous insulin in non-insulin-dependent diabetes mellitus in relation to blood pressure and cardiovascular hormonal status // Dial. Transplant. – 1996. – Vol. 11. – P. 794–802. 3. . ., . ., . . 2- // 4. . , - , . . ., . – 2006. – 3. – . 34–37. . . . – 2006. – 344 . . 5. - . . // . – 1998. – : 1. – . 7–18. . ( ). , . - . .( )– ; . 53-85-65; e-mail: gzyrina@yandex.ru . .– . .– . 8 (4822) -
